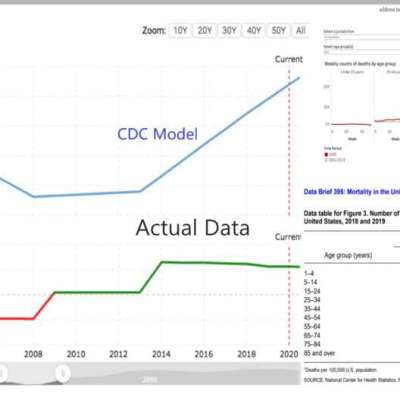
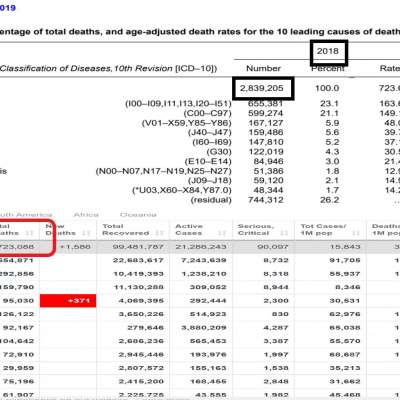
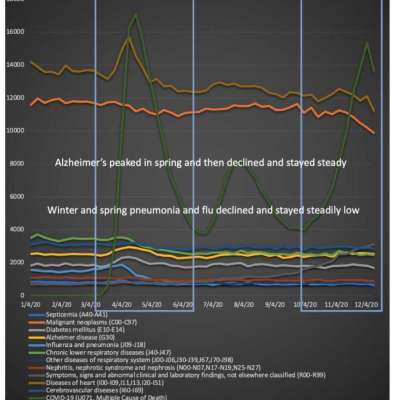
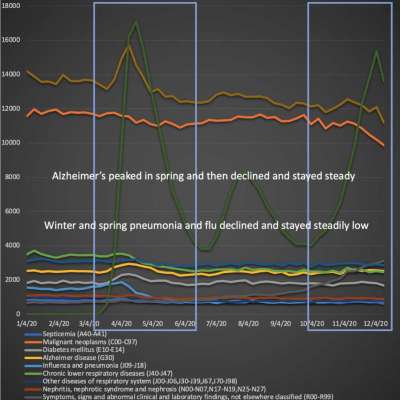
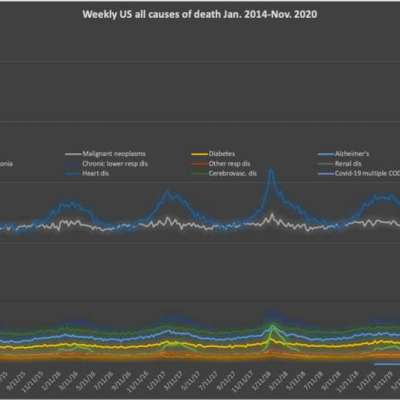
Same Numbers, they just changed all the categorizations. Its OK. Smart people put them all back. See. POOF No Pandemic We can see clearly in looking at previous years’ mortality data that peaks in winter mortality always included many categories of deaths peaking along with seasonal flu and pneumonia. And yet in 2020 we’re seeing only slight increases early in 2020 in Alzheimer’s, flu/pneumonia, and diabetes, as well as an early peak in heart disease deaths followed by a relatively sharp decline or leveling trend in all of these categories. They should be peaking again with Covid-19 deaths during the winter, as has always happened in previous years, but they’re not The anomalous nature of these small peaks, or lack of peaks entirely, for each mortality category is made clear in the following chart. Note how previous winter peaks in mortality are always the result of peaks in almost all of the deaths categories, led by heart disease and flu/pneumonia. he similarities across countries in these trends is readily explained when we realize that they almost all follow the WHO death certification and coding guidelines as described at CDC’s website: “Causes of death are coded according to the International Classification of Diseases, 10th Revision (ICD–1. On January 31, 2020, the World Health Organization (WHO) established a new emergency code for COVID-19: U07.1.”
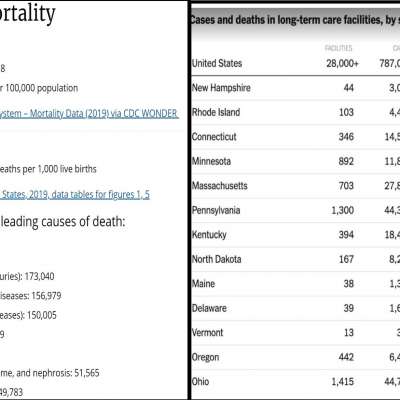
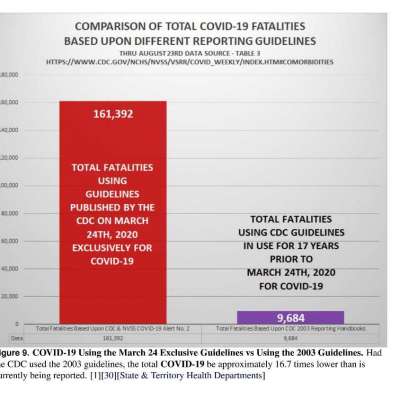
In sum, it seems clear that CDC is “borrowing” significant numbers of deaths in many major categories and counting them as Covid-19 deaths, reducing those other causes of death commensurately. This is particularly the case in nursing home and long-term care home populations because these populations have such a high mortality rate even in normal times. https://www.cdc.gov/nchs/data/....databriefs/db395-tab
thumb_up
 +6
+6